Think about the last video on your phone. Somewhere in those seconds is the exact frame you actually wanted. Not a screenshot taken a moment too late. Not a blurry thumbnail. The frame. Finding it is harder than it should be. Here’s why.
A Video Is Not What It Looks Like
Your phone is lying to you. What looks like continuous motion is actually a sequence of still photographs, played back fast enough that your brain stitches them into movement. At 30 frames per second, a one-minute video contains 1,800 individual photographs. A three-minute clip: 5,400. Each one is a complete, frozen moment. In video terminology, each photograph is called a frame.
A flipbook artist draws each page by hand. A camera does the same job automatically, capturing dozens of finished images every second. The principle is identical. Whether it is ink on paper or light through a lens, motion is just stills in sequence. Here is what that looks like through a camera rather than a pencil.
A sixty seconds video at 4K/30fps [frames per second], produces 1,800 frames [30 frames x 60 seconds] of the pitch, the running track, the stands, the sky. Most look nearly identical. A handful are genuinely interesting. Finding that handful is what this article is about.
Frame rate determines how many of those photographs exist per second:
- 24fps: cinematic. The slight blur between frames is part of the look.
- 30fps: natural. What most phones default to.
- 60fps: hyper-smooth. Some find it too crisp.
- 100fps: slow motion. Capture 100 frames per second, play back at 30, and time stretches by more than 3×.
Zoom In Far Enough, and the Illusion Breaks
Take one of those 1,800 frames. It looks like a photograph. Zoom in far enough and something strange happens.
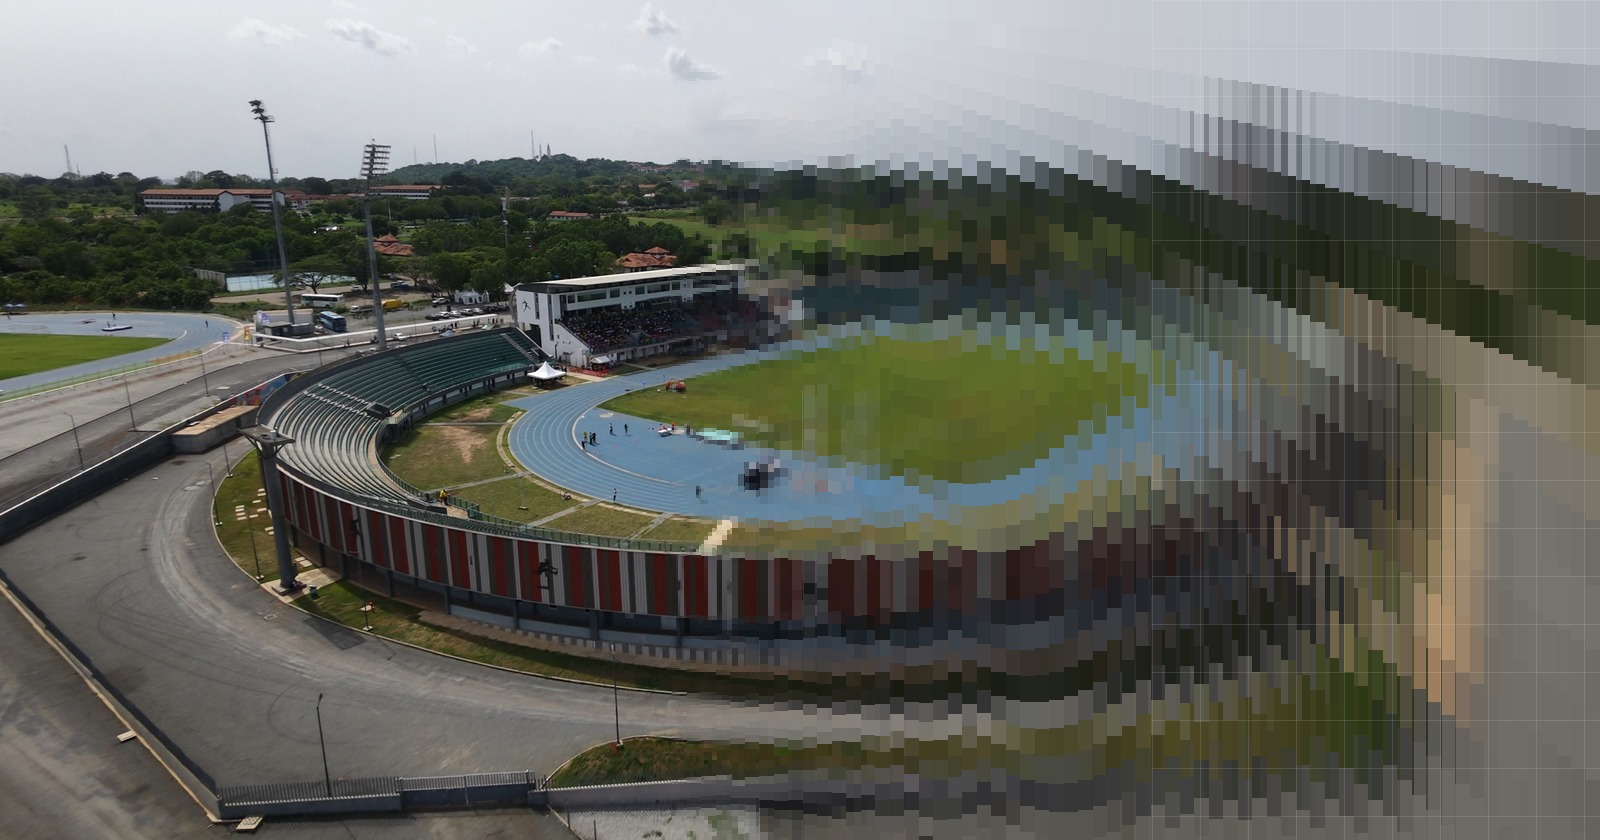
The image dissolves into a grid of tiny colored squares. Each square is one pixel, the smallest unit of a digital image. You can’t normally see them. But they’re always there.
Resolution is just how many pixels an image contains. The naming is slightly inconsistent, which trips people up: the “p” in 720p and 1080p refers to height. 720p = 720 pixels tall = 1,280 × 720 total. 1080p = 1,080 pixels tall = 1,920 × 1,080 total. Then the industry switched to naming by width. The “K” in 4K means roughly 4,000 pixels wide, specifically 3,840 × 2,160. Sometimes written as 2160p, but 4K stuck.
| Name | Width | Height | Total Pixels |
|---|---|---|---|
| 720p | 1,280 | 720 | ~921,000 |
| 1080p | 1,920 | 1,080 | ~2 million |
| 4K | 3,840 | 2,160 | ~8 million |
| 8K | 7,680 | 4,320 | ~33 million |
At 4K, a single stadium frame contains over 8 million data points. Nearly 9× more than 720p. A vehicle that’s unrecognizable at 720p may be readable at 4K. A face that’s a blur becomes identifiable. Resolution is the difference between data and noise.
A Pixel Is Just Three Numbers
This is where things get really interesting. A pixel doesn’t store a colour. It stores three numbers: red, green, and blue, each between 0 and 255. Every color on every screen you’ve ever looked at is a combination of those three values. Red: (255, 0, 0) Green: (0, 255, 0) Blue: (0, 0, 255)
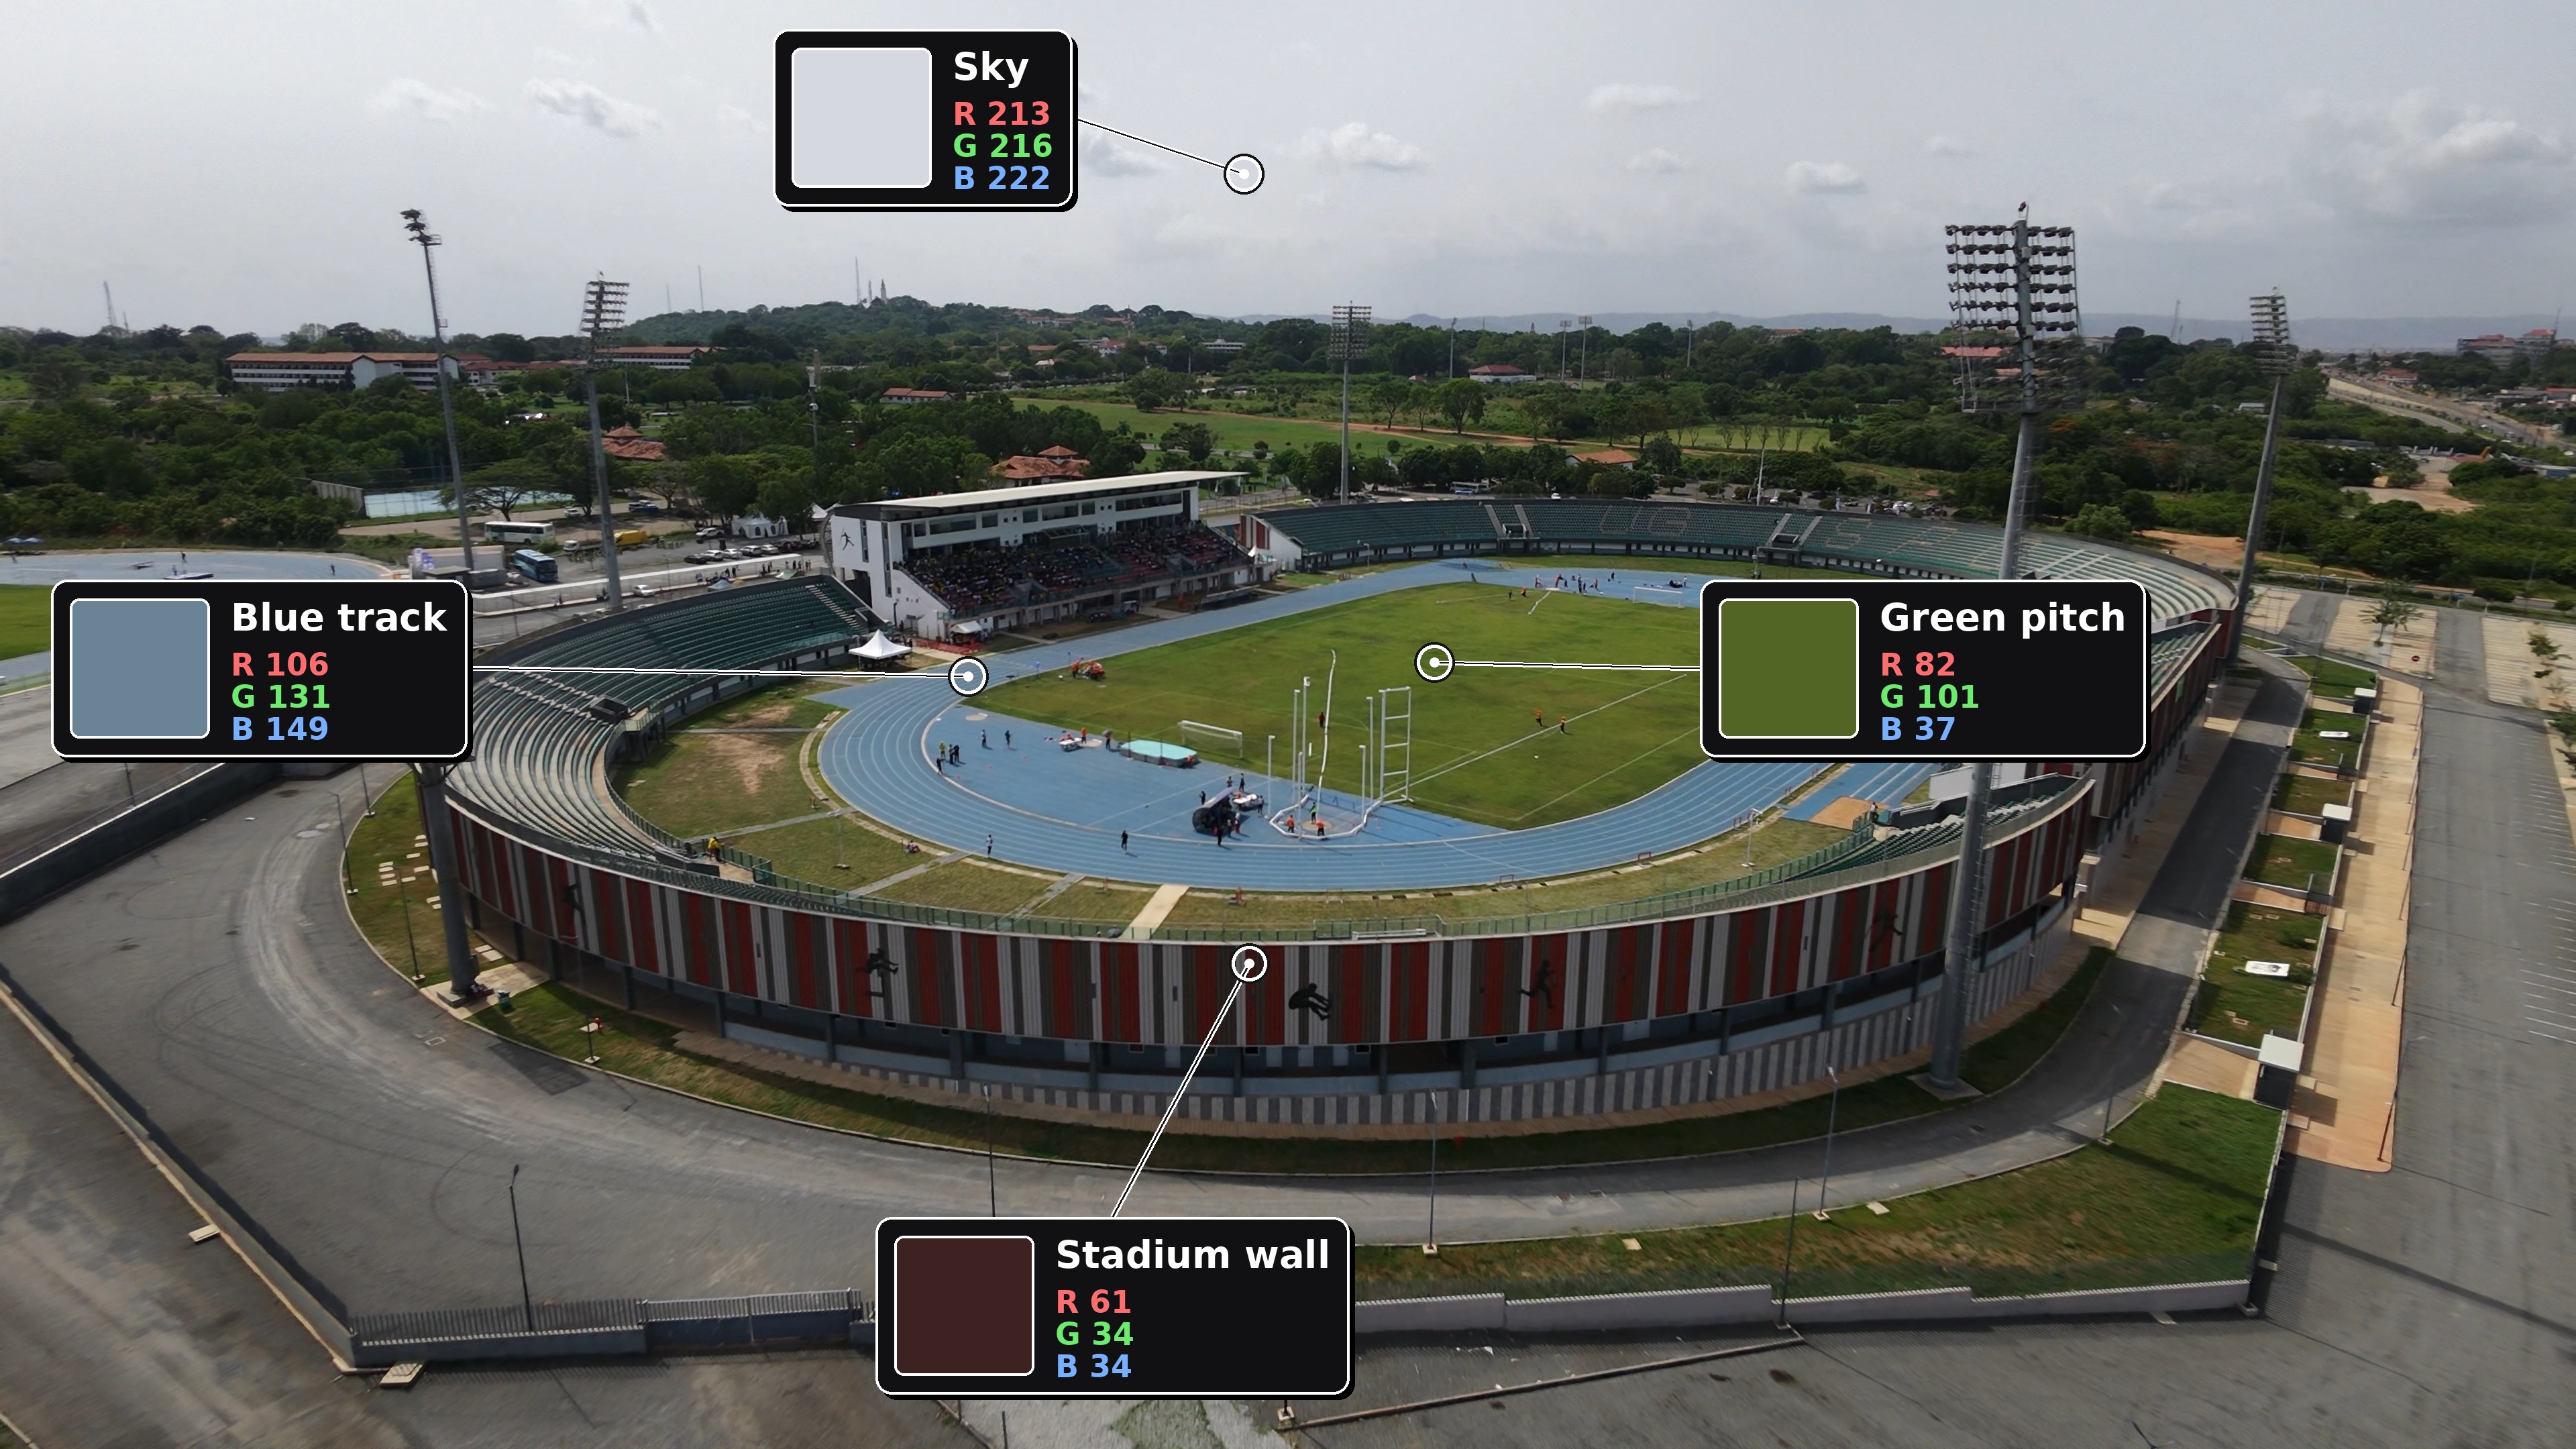
Look at that stadium frame. The green of the pitch: (82, 101, 37). The blue running track: (106, 131, 149). The sky: (213, 216, 222). The red stadium wall: (61, 34, 34). Three numbers. That’s all that separates grass from concrete.
Now consider what this means. A photograph of a stadium, or a face, or a sunset, or a city from above, is to a computer a table of numbers. A 4K image is a table with over 8 million rows, each containing three values between 0 and 255.
And once something is numbers, you can do mathematics on it. Compare values. Find patterns. Measure, rank, classify, analyze. The visual world becomes data. That’s the bridge this entire series is about crossing.
The Problem with 1,800 Frames
Back to the stadium footage. You want the best one or two frames to save as photographs. What makes a frame the best?
Three things:
- Sharpness. Fast camera movement smears pixel values across edges. Blurry frames are useless.
- Exposure. Shooting into bright sun collapses highlights into pure white, (255, 255, 255), with no information remaining.
- Composition. Harder to define, immediately recognizable.
The manual approach: scrub through, screenshot, repeat. It works. It’s also slow, imprecise, and easy to miss the exact frame you wanted because it passed in a fraction of a second. This problem is a wide spread one. It’s the parent looking for the clean still from a school play. The sports fan who caught a goal but needs the exact frame. The traveller with 40 minutes of footage and one image worth printing.
The moment is in the file. Getting to it reliably takes something more systematic.
VantageLabs and the Frame Extractor
This is what led me to build VantageLabs, a growing collection of computer vision tools for extracting intelligence from video and image footage, running entirely in your browser. No server. No upload. No account. Your footage never leaves your device.
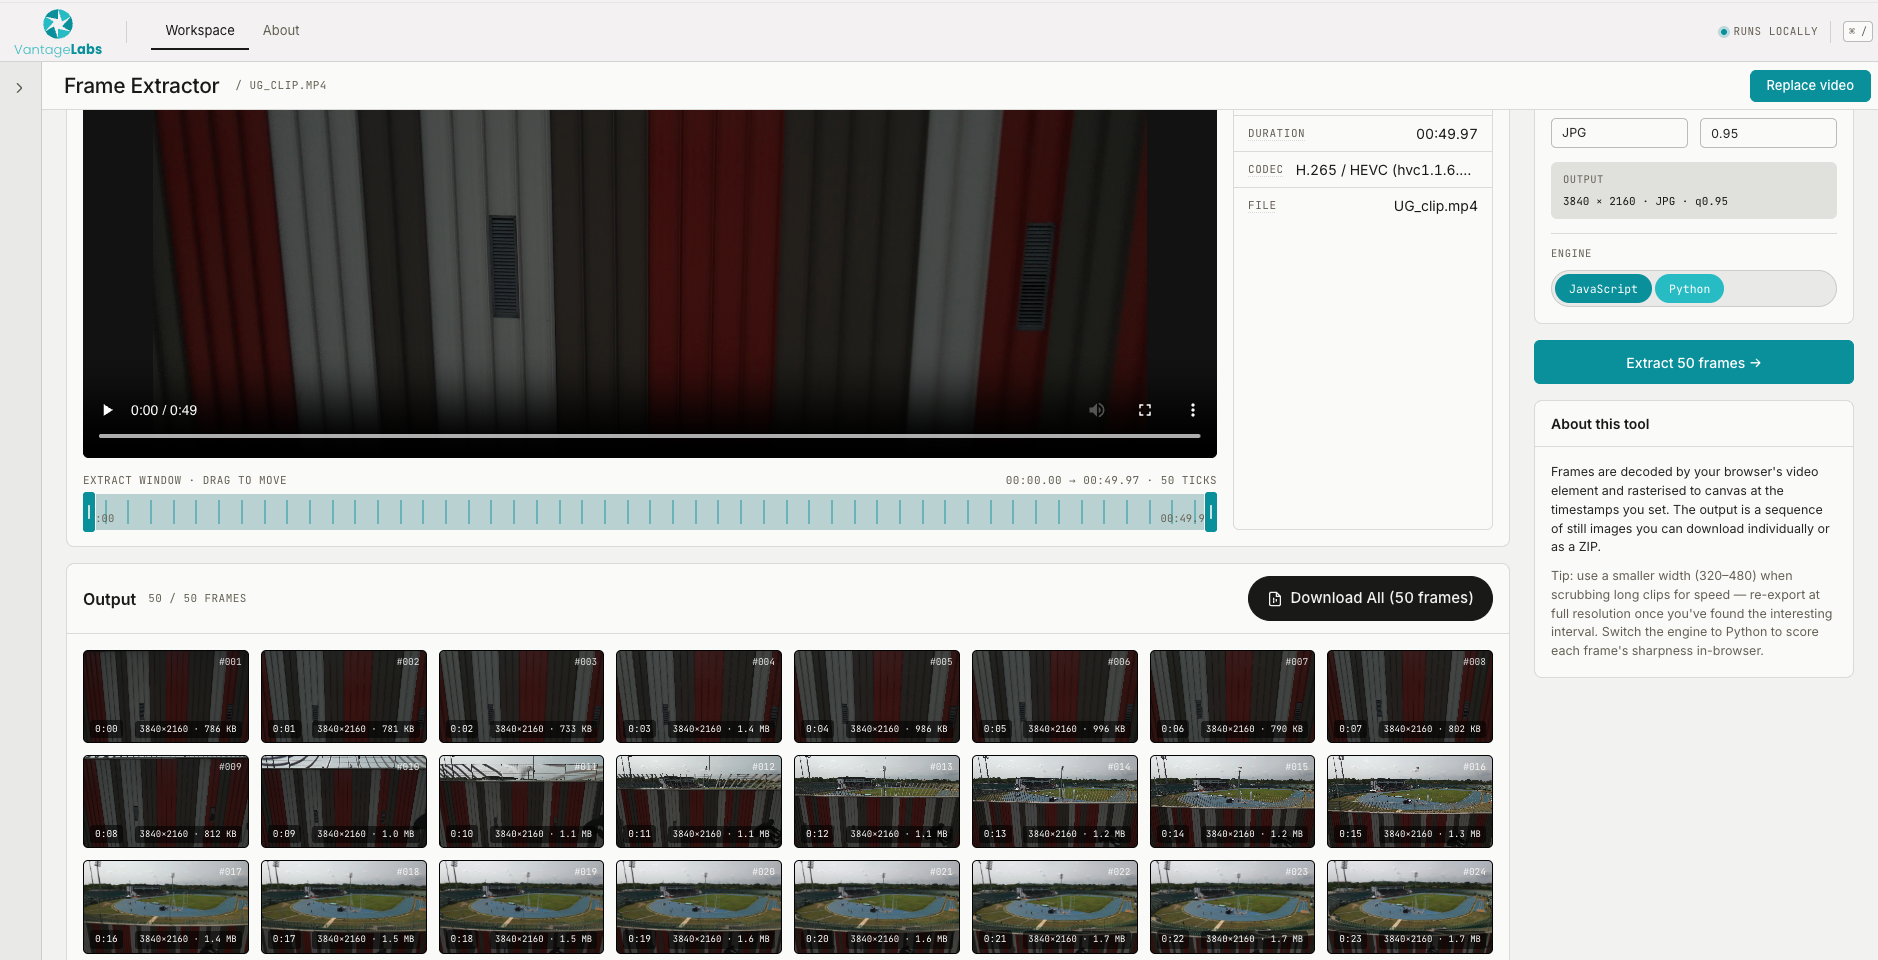
The frame extractor is the first tool and the foundation. Drop in any video: drone footage, phone clips, dashcam recordings, anything your browser plays, and it extracts every frame at your chosen interval, displays them as a grid, and lets you download the ones you want.
The architecture is simpler than you’d expect. Modern browsers already include a full video decoder, the same engine playing YouTube right now. The HTML5 Video element loads your file. The Canvas API reads each frame as raw pixel data. No server code needed. The full source is open on GitHub if you want to see how it works.
What this unlocks
Once every frame is accessible as a grid of numbers, questions that were buried in footage become answerable.
- Which frames are sharpest? Measure mathematically how dramatically pixel values change between neighboring pixels.
- What’s in the image? Color distribution tells you vegetation from water from built structures.
- Can a computer identify objects? People, vehicles, buildings, all detectable from pixel patterns.
- How many vehicles crossed this intersection? Count detections across frames.
- Can frames be stitched into a map? With overlapping images and the right algorithm, yes.
Every capability starts here: individual frames as data. The frame extractor is the door. Everything else is what’s behind it. Try it at vantage.lodonu.dev. Drop in any video and see what’s actually inside it.